User manual
Tutorial
This tutorial shows how to run a basic Itzï simulation using freely available dataset.
It assumes that GRASS 7 and Itzï are properly installed on your machine and that you possess a basic knowledge of GRASS.
Get ready
Here we will use the GRASS North Carolina data set. Please download the GRASS 7 version and extract it in your grassdata directory.
Then start GRASS in the PERMANENT mapset.
Adjust the region
Fit the lidar elevation raster map and set a resolution of 5m:
$ g.region -p raster=elev_lid792_1m@PERMANENT res=5 save=lidar_5m
Resample the DEM
Please note that this step is not strictly necessary. The Itzï simulation will be carried out in any case on the defined computational region extent and resolution. However the bilinear interpolation smooth the surface, which prevent high slope values that could occur if using the GRASS default nearest-neighbor sampling.
$ r.resamp.interp input=elev_lid792_1m@PERMANENT output=elev_lid792_5m
Create a raster mask
Generate a drainage direction map and then create a watershed raster using the outlet point coordinates:
$ r.watershed elevation=elev_lid792_5m drainage=elev_lid792_5m_drainage
$ r.water.outlet input=elev_lid792_5m_drainage output=watershed coordinates=638888,220011
Create a raster mask to prevent calculation outside of the watershed:
$ r.mask rast=watershed
Create boundary condition maps
Create a vector map with the watershed outlet point:
$ echo '638888|220011' > watershed_out.txt
$ v.in.ascii input=watershed_out.txt output=watershed_out
Using this vector map, create two raster maps for the boundary conditions. The first with a value corresponding to the type of condition, here 4 corresponds to a fixed water depth inside the domain. The second being the value of the depth wanted, here 0.
$ v.to.rast input=watershed_out type=point output=bctype use=val value=4
$ v.to.rast input=watershed_out type=point output=bcvalue use=val value=0
Create rainfall and friction maps
Create maps of uniform rainfall and friction coefficient:
$ r.mapcalc exp='rain=100'
$ r.mapcalc exp='n=0.05'
Run the simulation
Create a new parameter file and fill it with the created map. It should look like the following:
[time]
duration = 02:00:00
record_step = 00:05:00

[input]
dem = elev_lid792_5m@PERMANENT
friction = n@PERMANENT
rain = rain@PERMANENT
bctype = bctype@PERMANENT
bcval = bcvalue@PERMANENT

[output]
prefix = nc_itzi_tutorial
values = h, wse, v, vdir, boundaries

[statistics]
stats_file = nc_itzi_tutorial.csv
Run the simulation:
$ itzi run <parameter_file_name>
At the end of the simulation, Itzï should have generated five Space-Time Raster Dataset (STRDS) in the form:
<prefix>_<variable>
The maps contained in those STDRS are following this naming convention:
<prefix>_<variable>_<order_number>
Here is the example of the map nc_itzi_tutorial_h_0020:
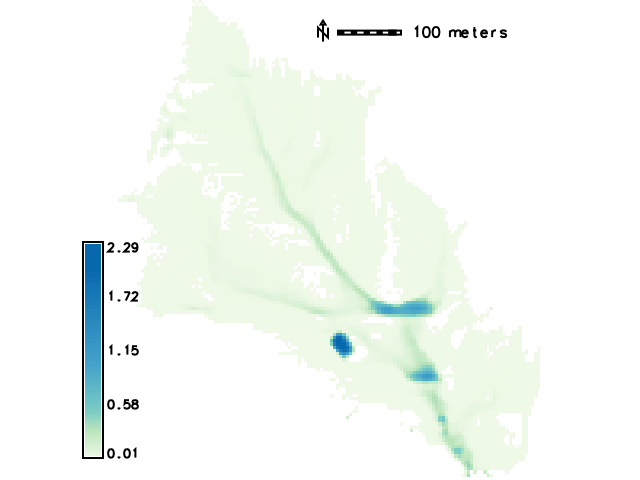
All the results can be processed using the GRASS tools for raster maps and / or space-time dataset. For instance, it is easy to generate an animation of the results using g.gui.animation.
Command line usage
Itzï is run from the command line.
Show the current version:
$ itzi version
Display the command line options:
$ itzi run -h
Configuration file
The parameters of a simulation are given through a configuration file in a format similar to Microsoft Windows INI files. An example is given in the tutorial above. The file is separated in sections described below.
[time]
Simulation duration could be given by a combination of start time, end time and duration. If only the duration is given, the results will be written as relative time STRDS. In case start time is given, the simulation will use a absolute temporal type.
| Keyword | Description | Format |
|---|---|---|
| start_time | Starting time | yyyy-mm-dd HH:MM |
| end_time | Ending time | yyyy-mm-dd HH:MM |
| duration | Simulation duration | HH:MM:SS |
| record_step | Time-step at which results are written to the disk | HH:MM:SS |
Valid combinations:
- start_time and end_time
- start_time and duration
- duration only
[input]
Itzï does not support Lat-Long coordinates. A projected location should be used. The inputs maps could be given either as STRDS or single maps. First, the module try to load a STRDS of the given name. If unsuccessful, it will load the given map, and stop with an error if the name does not correspond to either a map or a STRDS.
The following inputs are mandatory:
- Digital elevation model in meters
- Friction, expressed as Manning’s n
| Keyword | Description | Format |
|---|---|---|
| dem | Elevation in meters | map or strds |
| friction | Manning’s n (friction coefficient) | map or strds |
| start_h | Starting water depth in meters | map name |
| rain | Rainfall in mm/h | map or strds |
| inflow | Point inflow in m/s (ex: for 20 m3/s on a 10x10 cell, velocity is 0.2 m/s) | map or strds |
| bctype | Boundary conditions type | map or strds |
| bcval | Boundary conditions values | map or strds |
| infiltration | Fixed infiltration rate in mm/h | map or strds |
| effective_pororosity | Effective porosity in mm/mm | map or strds |
| capillary_pressure | Wetting front capillary pressure head in mm | map or strds |
| hydraulic_conductivity | Soil hydraulic conductivity in mm/h | map or strds |
| drainage_capacity | Drainage capacity in mm/h (new in 16.9) | map or strds |
Boundary conditions type are defined by an integer as follow:
- 0 or 1: Closed boundary (default if no map is given)
- 2: Open boundary: velocity at the boundary is equal to the velocity inside the domain
- 3: Not implemented yet
- 4: User-defined water depth inside the domain
Note
The “open” and “closed” boundary conditions are applied only at the border of the GRASS computational region.
Note
infiltration and any of the Green-Ampt parameters are mutually exclusives. Likewise, if any of the Green-Ampt parameter is given, all the others should be given as well.
[output]
| Keyword | Description | Format |
|---|---|---|
| prefix | Prefix of output STRDS | string |
| values | Values to be saved. Each one will be a STRDS | comma separated list |
The possible values to be exported are the following:
| Keyword | Description | Format |
|---|---|---|
| h | Water depth | meters |
| wse | Water surface elevation (depth + elevation) | meters |
| v | Overland flow speed (velocity’s magnitude) | m/s |
| vdir | Velocity’s direction. CCW from East | degrees |
| qx | Volumetric flow, x direction. Positive if going East | m³/s |
| qy | Volumetric flow, y direction. Positive if going South | m³/s |
| boundaries | Flow coming in (positive) or going out (negative) the domain due to boundary conditions. Average since the last record | m/s |
| infiltration | Infiltration rate. Average since the last record | mm/h |
| rainfall | Rainfall rate. Average since the last record | mm/h |
| inflow | Average user flow since the last record | m/s |
| drainage_cap | Average flow due to drainage capacity since the last record (new in 17.1) | m/s |
| verror | Total created volume due to numerical error since the last record (new in 17.1) | m³ |
Note
Additionally to output a map at each record_step, h and v also produce a map of maximum values.
Water depth maps, apart from map of maximum values, do not display values under the hmin threshold (See options)
[statistics]
| Keyword | Description | Format |
|---|---|---|
| stats_file | Statistics file | CSV table |
[options]
| Keyword | Description | Format | Default value |
|---|---|---|---|
| hmin | Water depth threshold in metres | positive float | 0.005 |
| cfl | Coefficient applied to calculate time-step | positive float | 0.7 |
| theta | Inertia weighting coefficient | float between 0 and 1 | 0.9 |
| vrouting | Routing velocity in m/s | positive float | 0.1 |
| dtmax | Maximum superficial flow time-step in seconds | positive float | 5 |
| dtinf | Infiltration time-step in seconds | positive float | 60 |
When water depth is under hmin, the flow is routed at the fixed velocity defined by vrouting (see Technical details).
[grass]
New in 16.9
Setting those parameters allows to run simulation outside the GRASS shell. This is especially useful for batch processing involving different locations and mapsets. If Itzï is run from within the GRASS shell, this section is not necessary.
| Keyword | Description | Format |
|---|---|---|
| grass_bin | Path to the grass binary | string |
| grassdata | Full path to the GIS DataBase | string |
| location | Name of the location | string |
| mapset | Name of the mapset | string |
With Linux, grass_bin could be simply “grass”. On Windows, the full path is necessary.
Statistics file
The statistic file is presented as a CSV file. As of version 17.1, the values that are output are shown in the table below.
Water entering the domain is represented by a positive value. Water that leaves the domain is negative. Volumes are in m³.
| Keyword | Description |
|---|---|
| sim_time | Elapsed simulation time |
| avg_timestep | Average time-step duration since last record |
| #timesteps | Number of time-steps since the last record |
| boundary_vol | Water volume that passed the domain boundaries since last record |
| rain_vol | Rain volume that entered the domain since last record |
| inf_vol | Water volume that left the domain due to infiltration since last record |
| inflow_vol | Water volume that entered or left the domain due to user inflow since last record |
| drain_cap_vol | Water volume that entered or left the domain due to drainage capacity since last record |
| domain_vol | Total water volume in the domain at this time-step |
| created_vol | Water volume created due to numerical errors since last record |
| %error | Percentage of the domain volume variation due to numerical error. Corresponds to created_vol / (domain_vol - old_domain_vol) * 100 |